Radial velocity and size of scrape-off-layer filaments, measured from 100 kHz imaging of a tokamak edge
A tokamak uses magnetic fields to confine a fusion plasma, but the confinement fails at the edge. There, the plasma sheds filaments, narrow strands of hot and dense plasma aligned with the magnetic field. Filaments move outward through the scrape-off layer and carry much of the heat and particles that cross it. Their radial velocity sets how wide the heat-flux profile is, and so how much load the wall and divertor must take. For a fusion reactor, that load is one of the hardest design limits.
Theory links a filament's velocity to its size. If the filament's current closes through the sheath at the divertor, velocity falls as the inverse square of size, so large filaments are slow. If the current closes inside the filament, velocity grows as the square root of size, so large filaments are fast. The two-region model joins these limits and predicts a fastest size in between. Testing it takes velocities and sizes for many filaments. Earlier imaging studies measured only a few discharges at a time.
The Mega Amp Spherical Tokamak (MAST) filmed its edge with a fast camera. In one mode, the camera reads a 48 by 256 pixel strip across the plasma edge every 10 microseconds. These recordings are public in the FAIR-MAST archive, but they come with no spatial calibration. This analysis tracks filaments in every usable recording, recovers the pixel scale from the magnetic equilibrium, and compares the results with the two-region model.
(This project was based on my favorite physics class on plasmas, AA 244A, and was also a computer vision class final project. For more physics, you should check out my physicist cousin, Josh!)
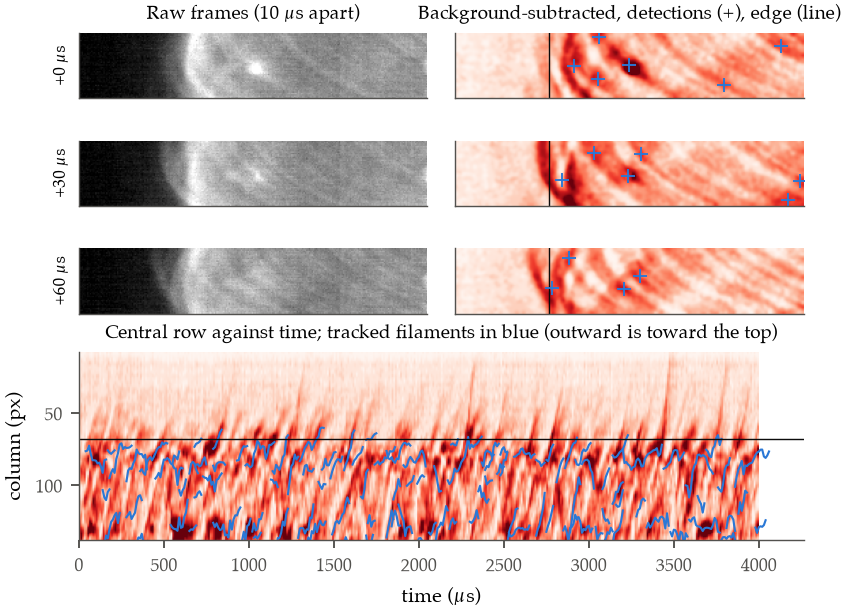
Pipeline. Each frame has its background removed and is thresholded against the noise. Bright regions become detections. Detections in consecutive frames are linked into tracks, and each track's velocity is the slope of its position against time. Optical flow and cross-correlation give two independent checks on that velocity.
Calibration. The brightest feature in each frame is the plasma limb, where the line of sight grazes the plasma edge. When the edge moves outward, the limb moves across the sensor. Comparing the two across many discharges gives the pixel scale, between 2.7 and 5.2 mm per pixel depending on the camera setup. The uncertainty is 10 to 30%.
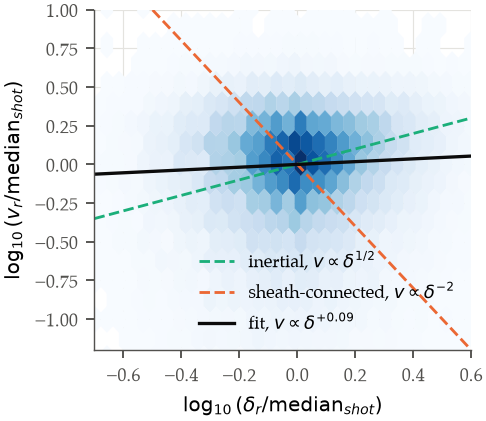
Velocity and size. Across 86,042 tracks in 294 discharges, the median filament moves outward at 424 m/s and is 3.6 cm wide. Velocity barely depends on size. After correcting for blur during the camera exposure, the log-log slope is +0.05 (95% interval +0.03 to +0.07). Neither limiting scaling fits (Figure 2).
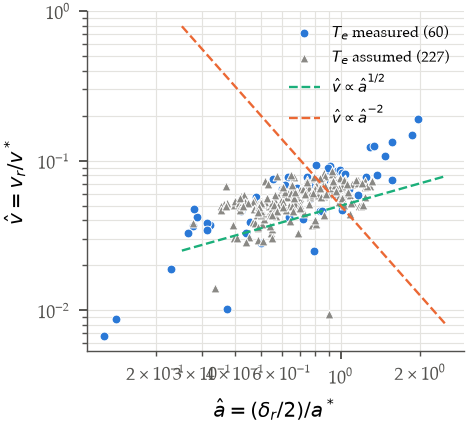
Comparison with the model. In the model's units, the filaments sit on both sides of the predicted fastest size. That explains why speed hardly changes with size. But the filaments move at only about 6% of the model's velocity scale. The model's uncertainty does not cover a gap that large (Figure 3).
The paper covers the calibration, the blur correction, and how the results change with plasma current and density.