Severity and weakness labels from NIST, reconstructed for new vulnerabilities from their descriptions
Collaborator(s): Tara Dixit, Summer Li
When software vulnerabilities (such as Heartbleed or Log4Shell) are disclosed, they are recorded in the Common Vulnerabilities and Exposures (CVE) catalog with an identifier and a short description. CVE-2024-0003, for example, describes a flaw in which "a malicious user could use a remote administrative service to create an account on the array allowing privileged access."
A problem is that this description does not indicate how urgently the flaw must be addressed. Prioritization relies on two further labels. A CVSS score rates severity from 0 to 10 based on how the flaw is exploited and what it affects, and a CWE names the type of weakness. Assigning them requires judgment. For CVE-2024-0003, the vendor scored 9.1 (Critical) and NIST scored 7.2 (High).
The National Vulnerability Database at NIST used to supply both labels for most CVEs. In April 2026, NIST announced that it would do so only for high-priority vulnerabilities. Most new CVEs now arrive with a description and no NIST-assigned labels, which raises the question of how accurately the labels can be inferred from the description alone.
Setup. Models are trained on CVEs disclosed in 2022 and 2023 (50,545 CVEs) and evaluated on every usable CVE from 2024 (36,325 CVEs), so that no model is scored on the period it was trained on. The comparison covers a TF-IDF logistic regression baseline and Phi-3.5-mini, a 3.8B-parameter language model, used both zero-shot and after fine-tuning with LoRA for one epoch.
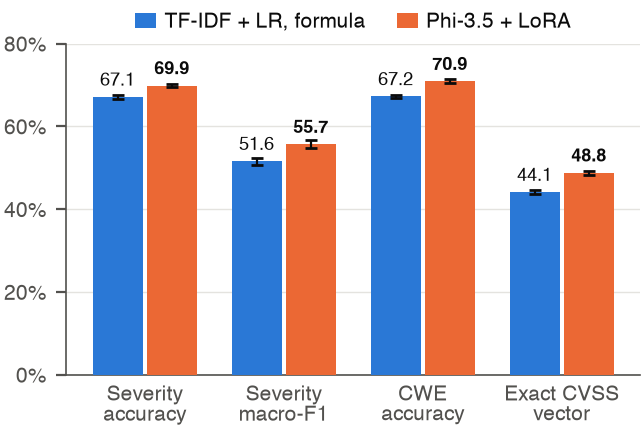
Fine-tuning against a lexical baseline. The fine-tuned model achieves the highest performance on every field, with 69.9% severity accuracy against 67.1% for TF-IDF and 70.9% CWE accuracy against 67.2%. It predicts the complete CVSS vector exactly for 48.8% of test CVEs, compared with 44.1%. The improvements range from 2.8 to 4.7 percentage points, and the paired bootstrap interval for each excludes zero. The margins are nonetheless modest, indicating that a lexical baseline remains competitive on this task.
Consistency between score and vector. Because the CVSS base score is a deterministic function of the vector, a model's predicted score can be checked against the score implied by its own predicted vector. Used zero-shot, Phi-3.5-mini produces a score consistent with its vector for 3.4% of CVEs. After fine-tuning on targets that list the vector components before the score, the two agree for 99.8% of CVEs.
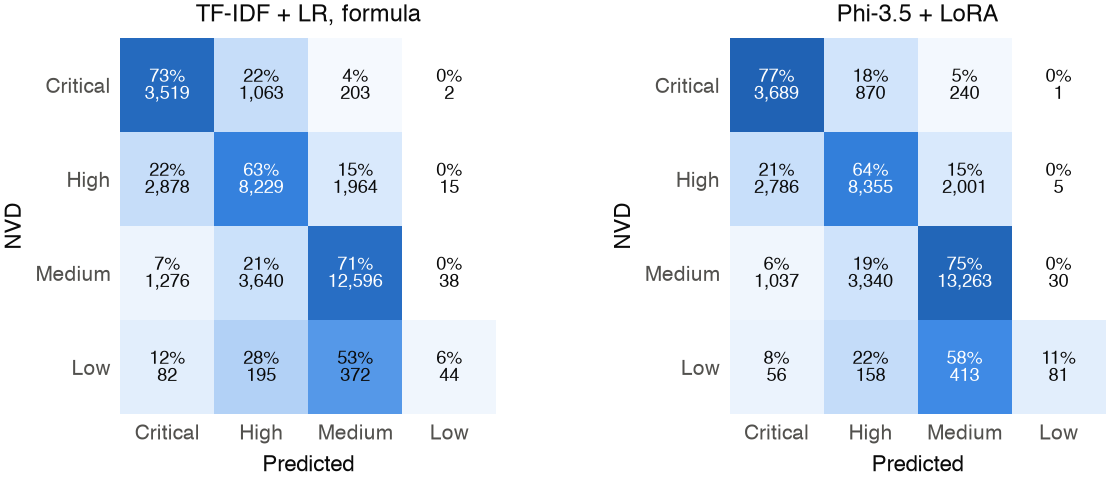
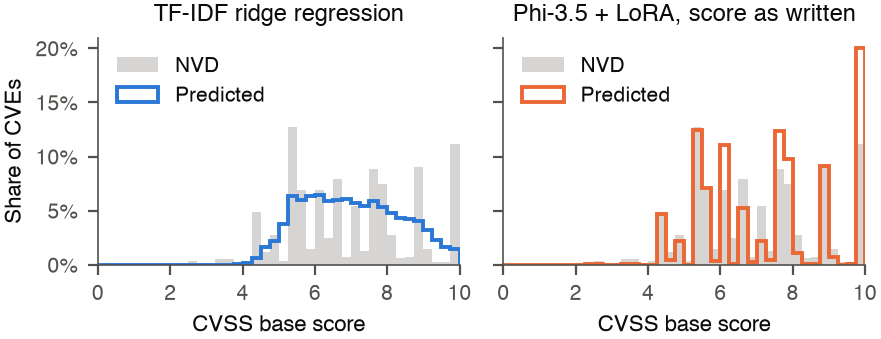
Error structure. Most severity errors fall between adjacent tiers (Figure 2). The Low tier, which accounts for under 2% of the training data, is the most poorly predicted by every system. The fine-tuned model's scores lie on the discrete values that the CVSS formula produces, but it assigns the most common critical score, 9.8, to 20.0% of test CVEs, against 10.5% in NVD (Figure 3).
Full experimental details, including per-component accuracy and the zero-shot comparison, are given in the paper.