
Satellite burn severity maps scored against USGS analysts on held-out wildfires
A burn severity map shows how much a wildfire changed the vegetation and soil at each location. Land managers use it after a fire to decide where to stabilize slopes before the first rains and which forests need replanting. In the United States, the Monitoring Trends in Burn Severity (MTBS) program maps every large fire from Landsat imagery. An analyst computes the differenced Normalized Burn Ratio (dNBR), which rises where near-infrared reflectance falls and shortwave-infrared reflectance increases after the fire, and chooses dNBR thresholds that separate four severity classes.
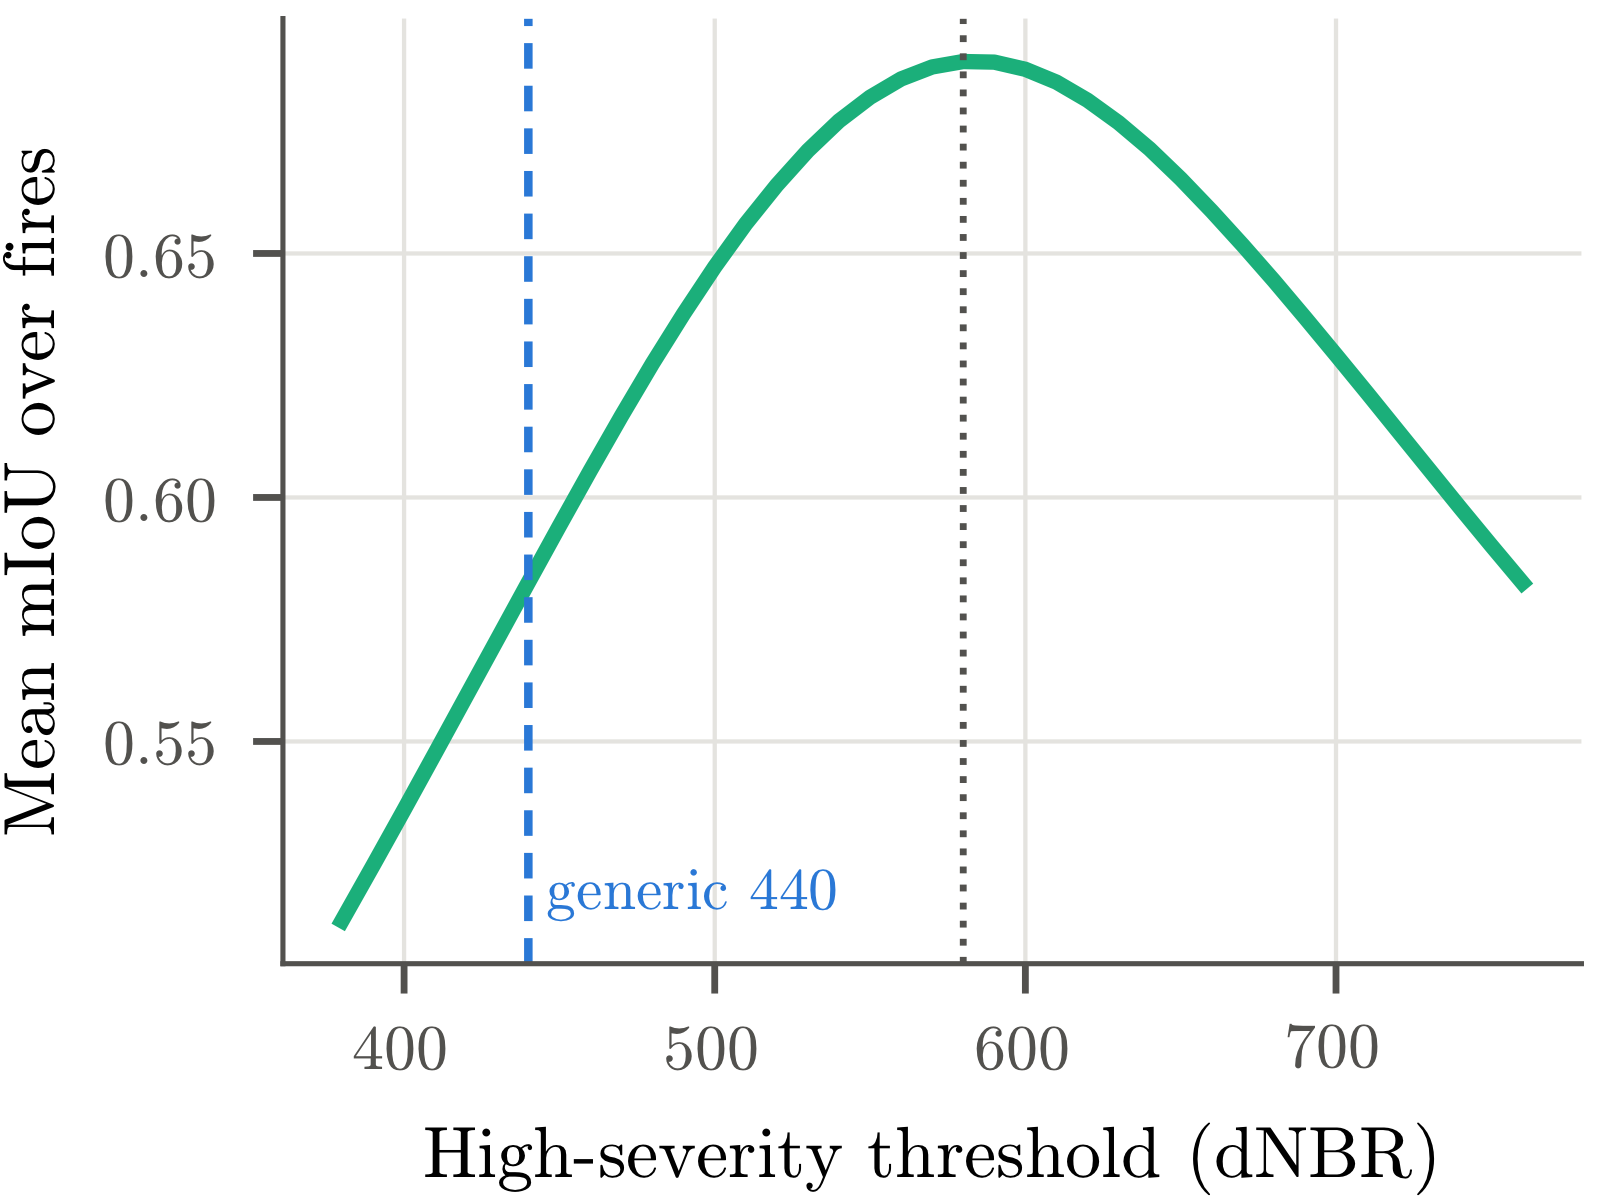
A problem is that the thresholds differ from fire to fire. Across 31 recent California and Oregon wildfires, the analyst's threshold between moderate and high severity ranges from 480 to 685 dNBR units, and every value lies above the generic threshold of 440 often used in its place. A method that maps a new fire automatically must either estimate its thresholds or learn severity directly from the imagery with a neural network.
Data. The dataset contains 31 large California and Oregon wildfires from 2018 to 2021, with 7.1 million acres and 31.4 million labeled pixels in all. Each fire is represented by the exact pair of Landsat scenes named in its MTBS record, with the post-fire scene acquired in the growing season after the fire. Both scenes are converted to surface reflectance and warped onto the 30 m grid of the MTBS map, so the labels are never resampled and the inputs match what the analyst saw.
Cross-validation by fire. Three pairs of fires overlap. The 2020 North Complex, for example, burned into the scar of the 2018 Camp Fire. Fires that overlap are grouped, and whole groups are assigned to five folds of about 1.4 million acres each. Every fire is therefore scored by a model that has seen neither that fire nor any fire that overlaps it.
Methods. The simplest classifier applies the generic dNBR thresholds of 100, 270, and 440. A learned classifier instead searches for the three thresholds that maximize mean mIoU over the training fires, weighting every fire equally. The same search is applied to two relativized indices, RdNBR and RBR, which divide dNBR by a function of pre-fire vegetation. A per-pixel gradient-boosting classifier uses all twelve reflectance values together with five indices, and a U-Net with 7.8 million parameters adds spatial context. An oracle applies each test fire's own analyst thresholds and serves as a reference ceiling.
Threshold calibration. Learning the thresholds raises mean mIoU from 0.564 to 0.684 and improves 29 of 31 fires (Figure 2). The learned moderate/high threshold lies between 577 and 596 across folds, far above the generic 440. Generic thresholds over-predict severity. They recover 99.3% of high-severity pixels, but only 63.5% of the pixels they label high are high in the MTBS map, and they recover 48.7% of moderate pixels. With learned thresholds, high-severity precision rises to 89.1% and moderate recall to 80.5%.
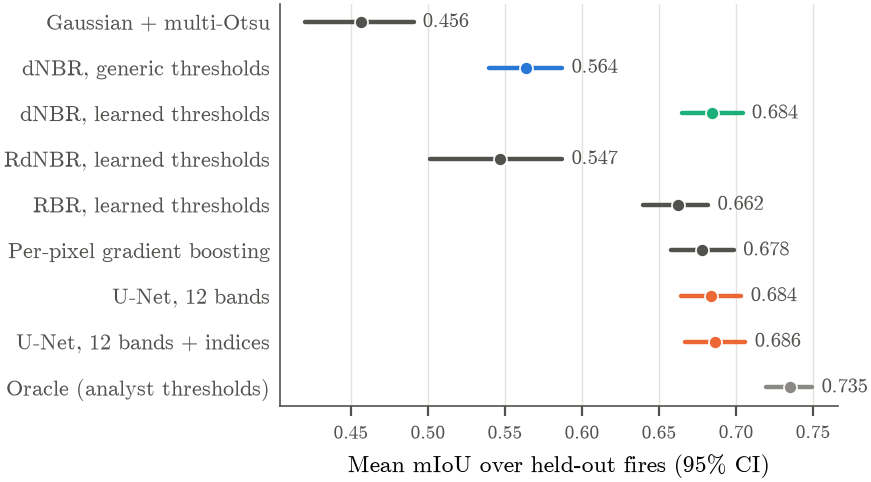
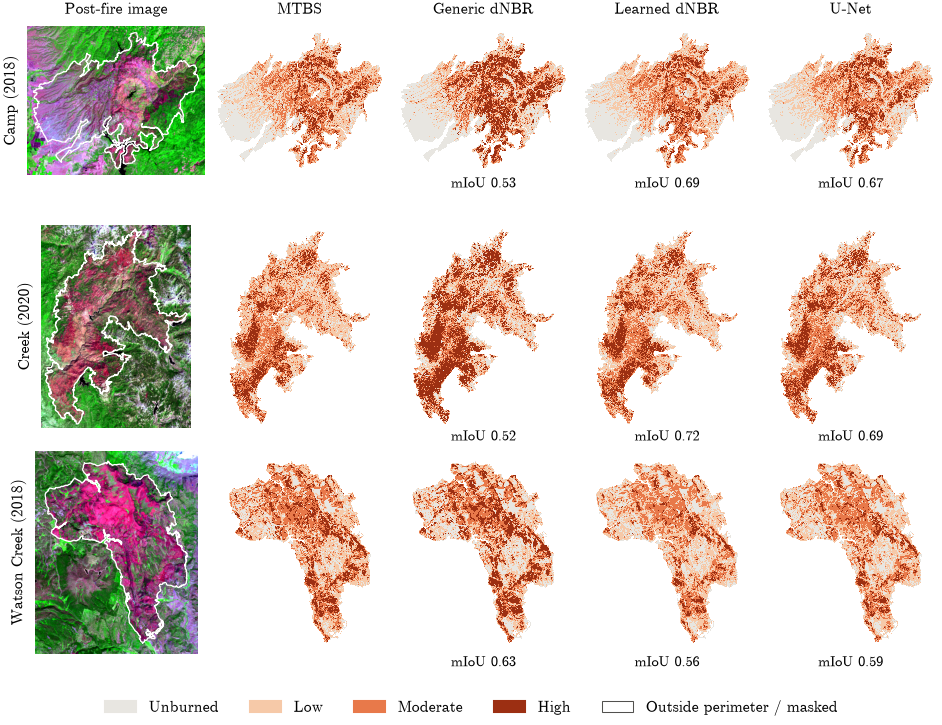
Comparison with a U-Net. A U-Net on the twelve reflectance bands achieves 0.684, and one with five additional index channels achieves 0.686. Their paired differences from learned dNBR are −0.001 and +0.002, with 95% intervals that include zero, and each is better on about half the fires. The U-Net with index channels is slightly better than gradient boosting, by 0.008, so spatial context helps a classifier that lacks it but does not improve on a calibrated dNBR rule. Learned thresholds and the U-Net produce nearly identical maps (Figure 3). RBR with learned thresholds reaches 0.662, and RdNBR, which becomes unstable where pre-fire vegetation is sparse, reaches 0.547.
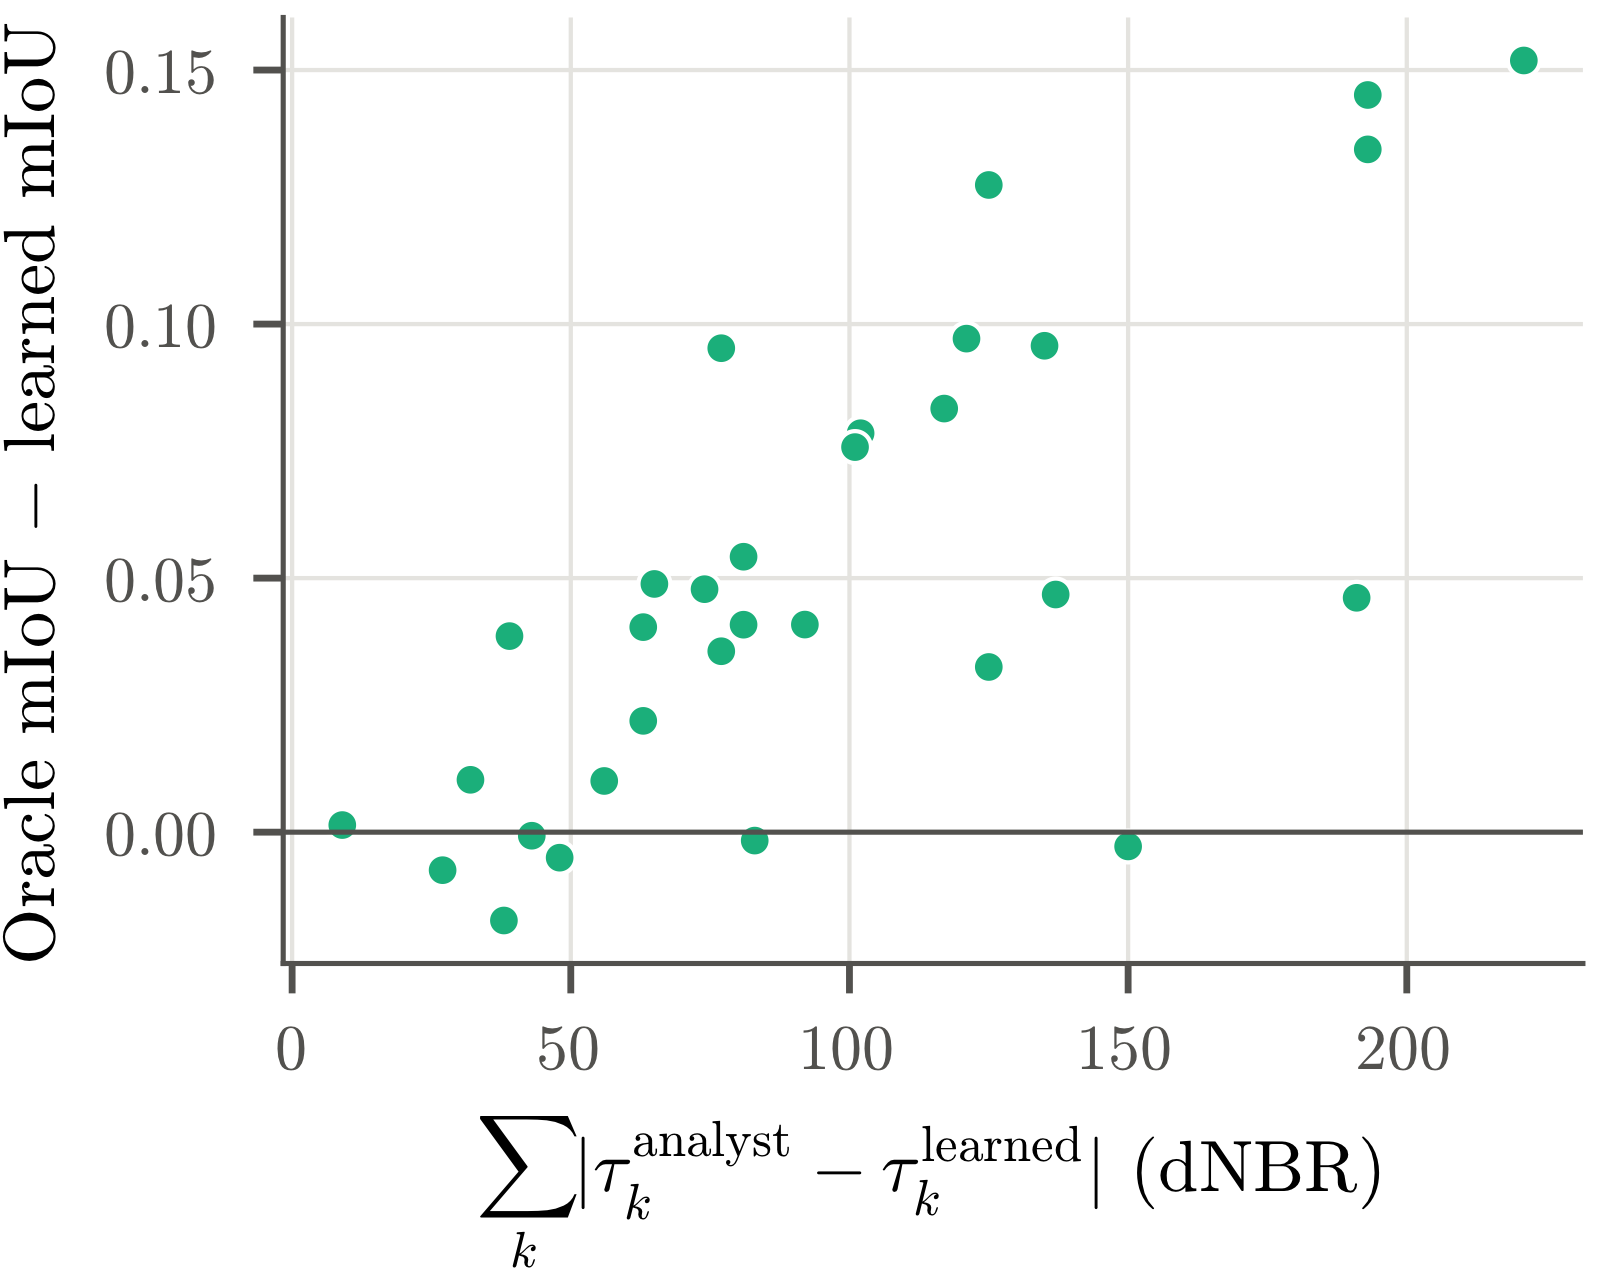
Per-fire calibration. The oracle achieves 0.735, which is 0.051 above learned dNBR, and is better on 25 of 31 fires. Its advantage on a fire grows with the distance between that fire's analyst thresholds and the learned ones (Spearman ρ = 0.68, Figure 4). Learned thresholds therefore fall furthest short on the fires whose analysts departed most from typical values. Across all fires, a single moderate/high threshold near 580 fits best, and mean mIoU stays within 0.01 of its maximum between 550 and 620 (Figure 5).
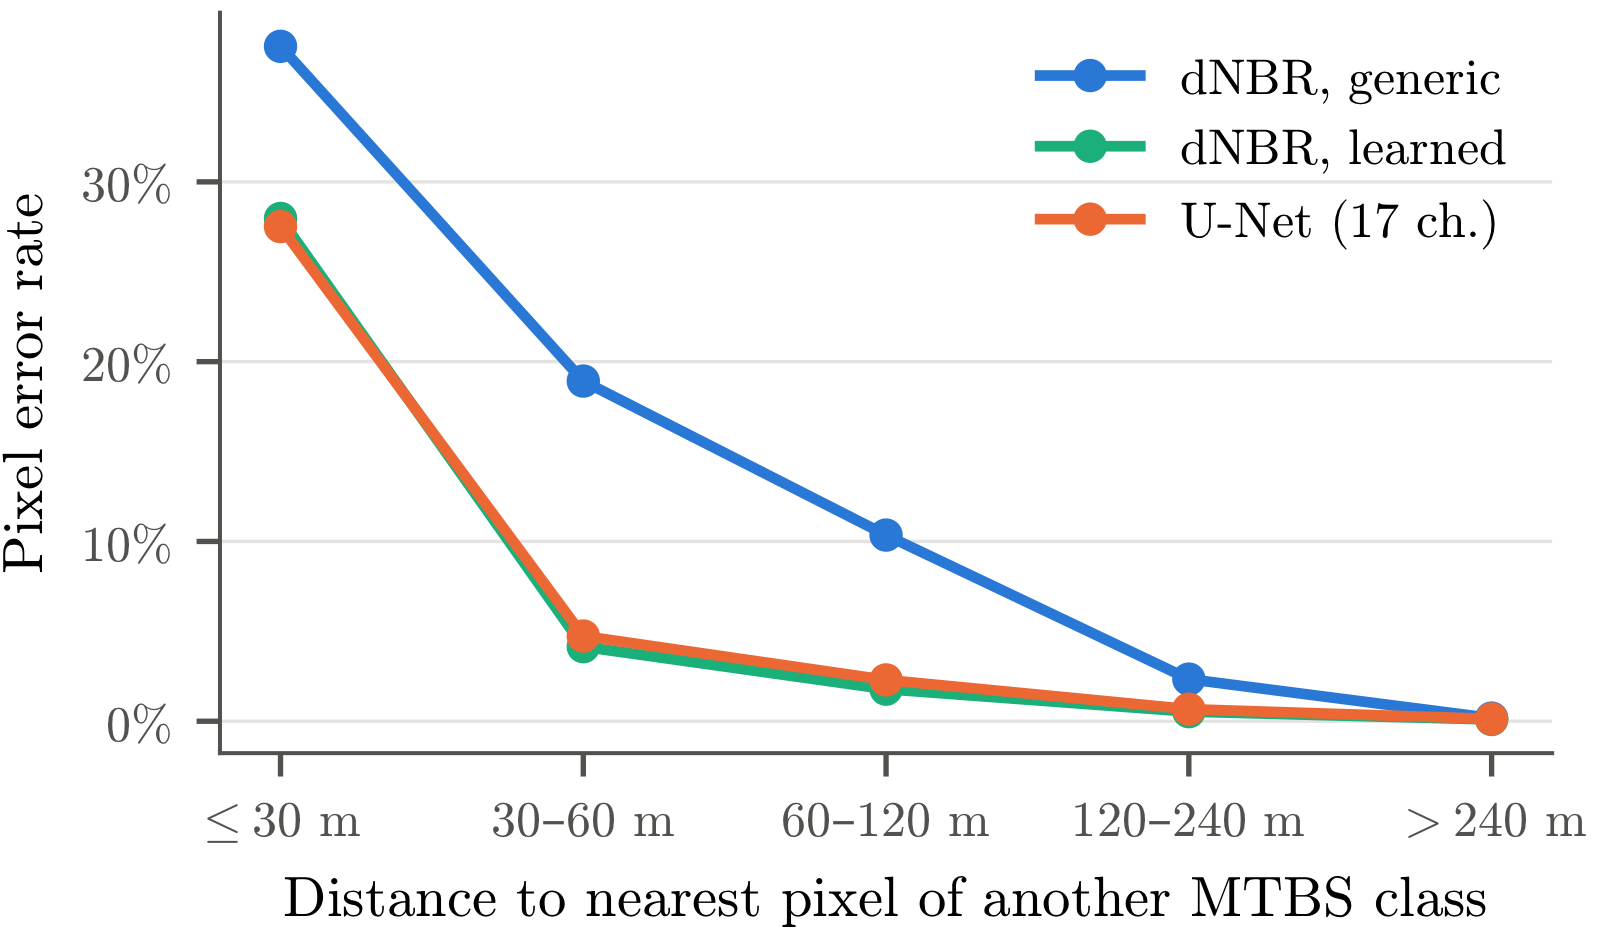
Error structure. Of the errors made with learned thresholds, 99.8% confuse adjacent severity classes. MTBS maps are spatially fragmented, and 57.7% of labeled pixels lie within 30 m of a pixel of another class. The error rate is 28.0% within 30 m of a class boundary and 0.1% beyond 240 m, and the U-Net follows the same profile (Figure 6). Near a boundary, the median pixel lies 47 dNBR units from an analyst threshold, against 199 far from one, so a small shift in a threshold changes its class.
Label construction. When analyst maps are unavailable, labels can be made by applying the generic thresholds to dNBR. For the Camp Fire, such labels agree with the MTBS map on 70.5% of pixels. A per-scene percentile stretch of each band lowers agreement to 52.1%, and Landsat composites from weeks after the fire, rather than from the next growing season, lower it to 43.5%.